A host of articles are chronicling the new developments — and the fears – in the uses of AI in K-12 education. To take stock of these developments, IEN pulls together links from a search for articles about and OECD’s Digital Education Outlook 2026 and a google news search for articles related to “AI schools education students learning” over the past month. Along with recent books like Artificial Intelligence and Education in the Global South and reports like Brookings’ A new direction for students in an AI world: Prosper, prepare, protect, these articles give a glimpse of what AI use looks like in different classroom contexts and highlight many of the concerns about those uses. These articles chronicle as well the efforts by many of the leading AI companies to cultivate new customers among students, teachers and schools.
From OECD
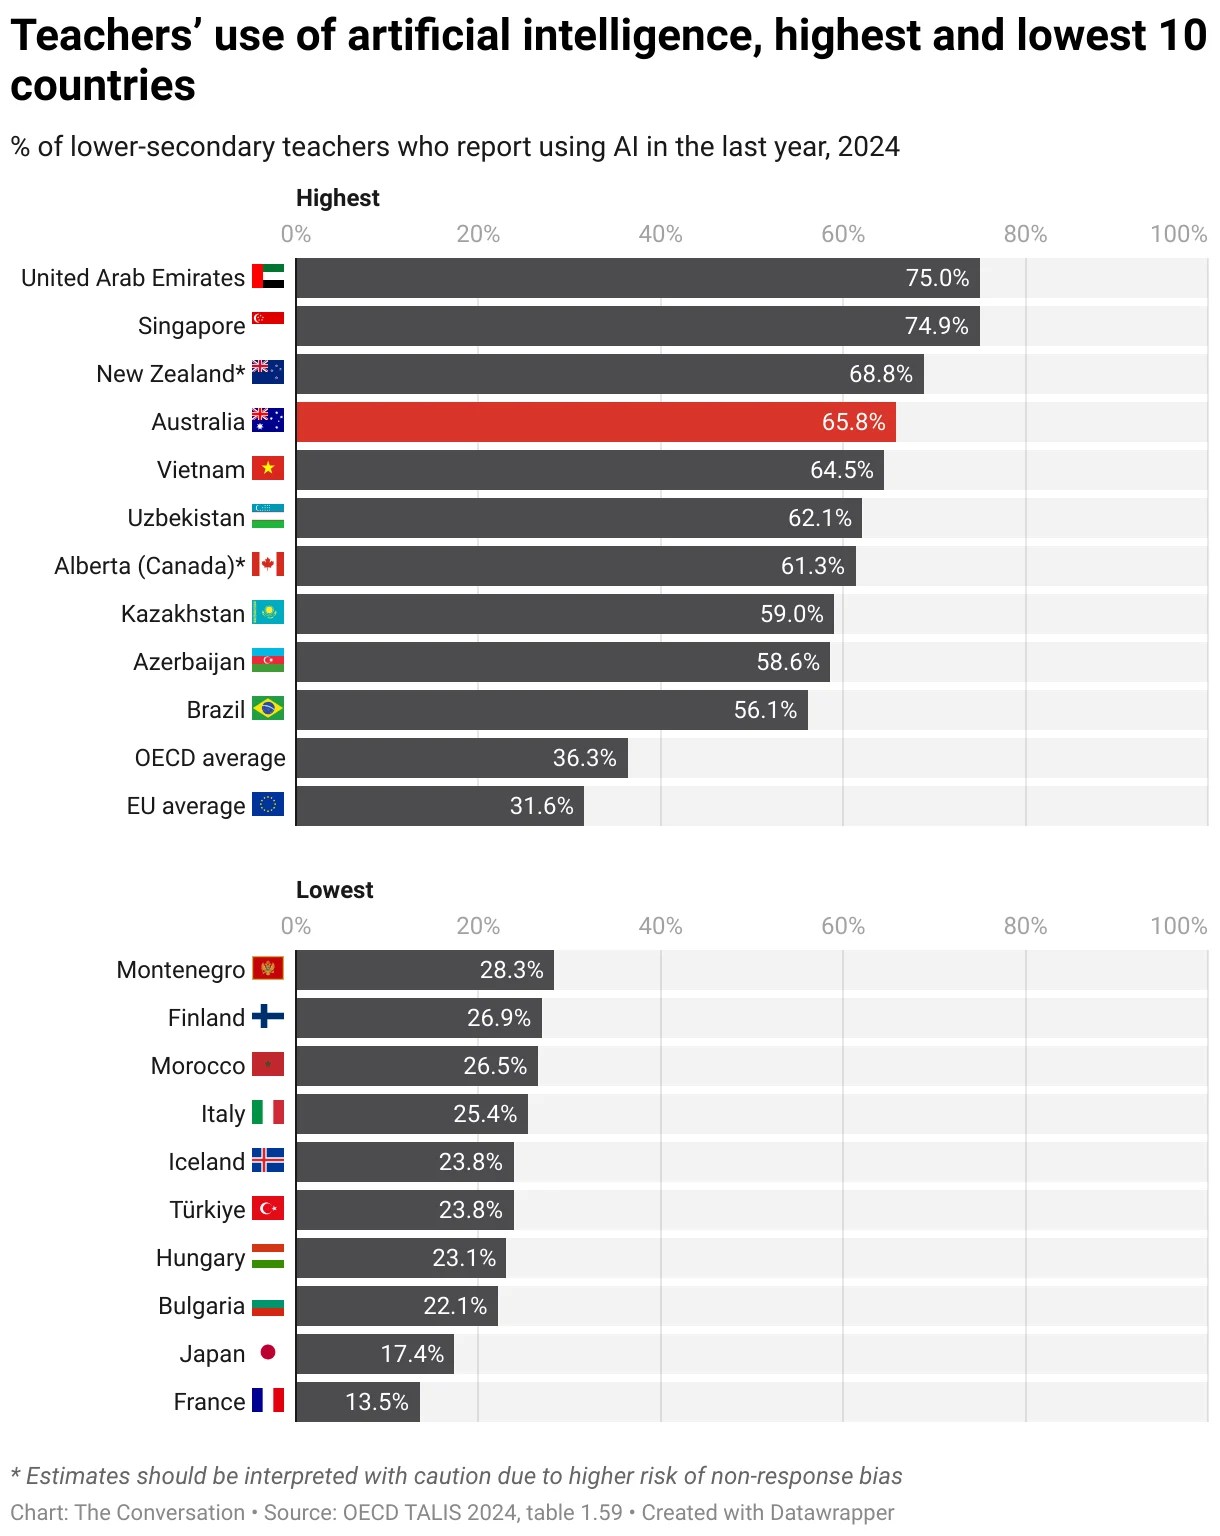
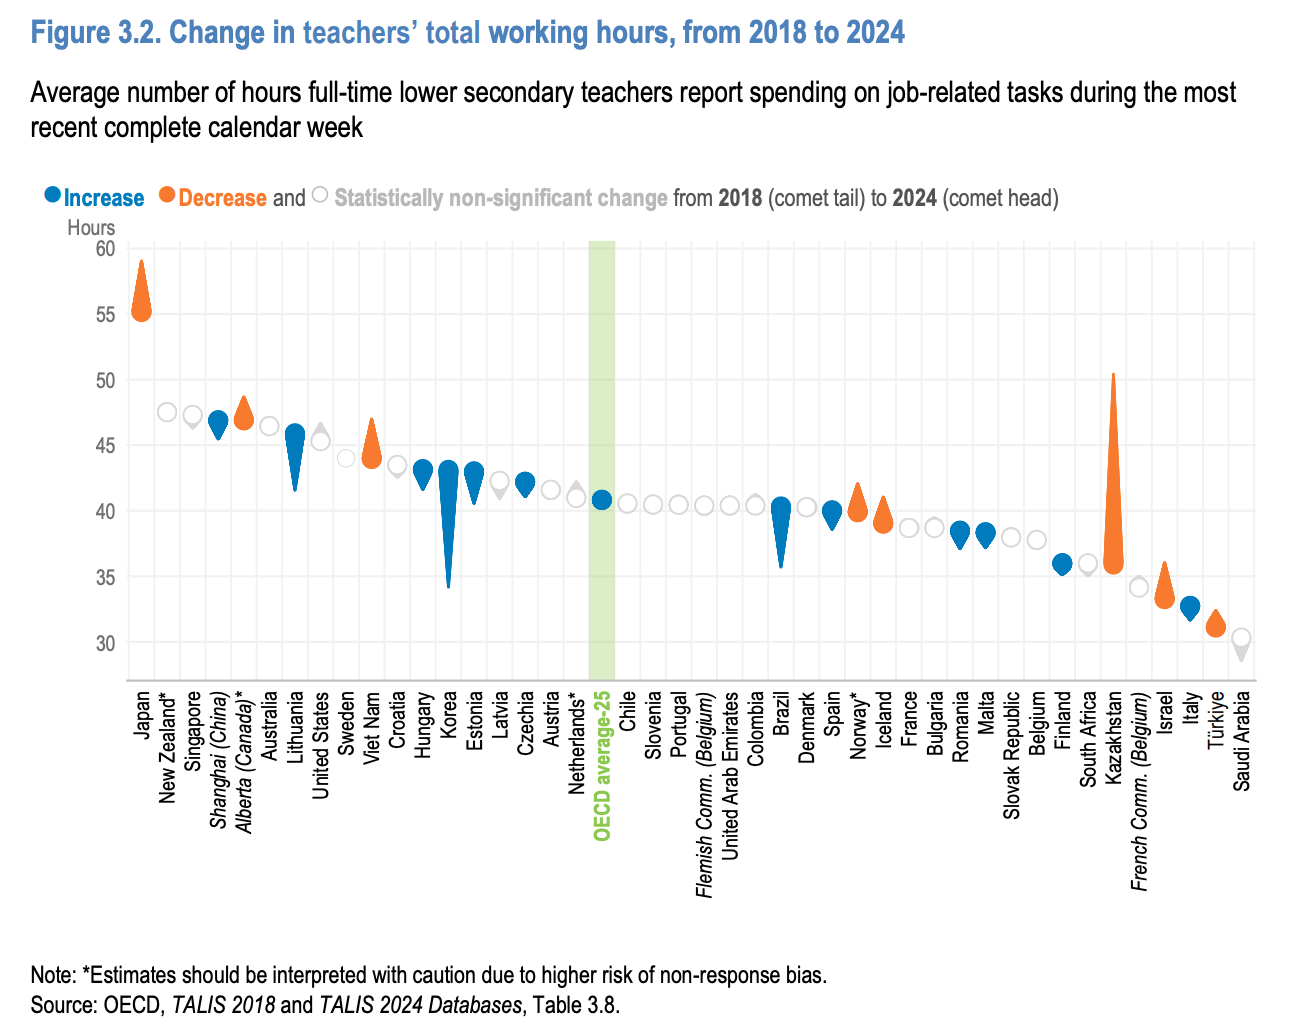
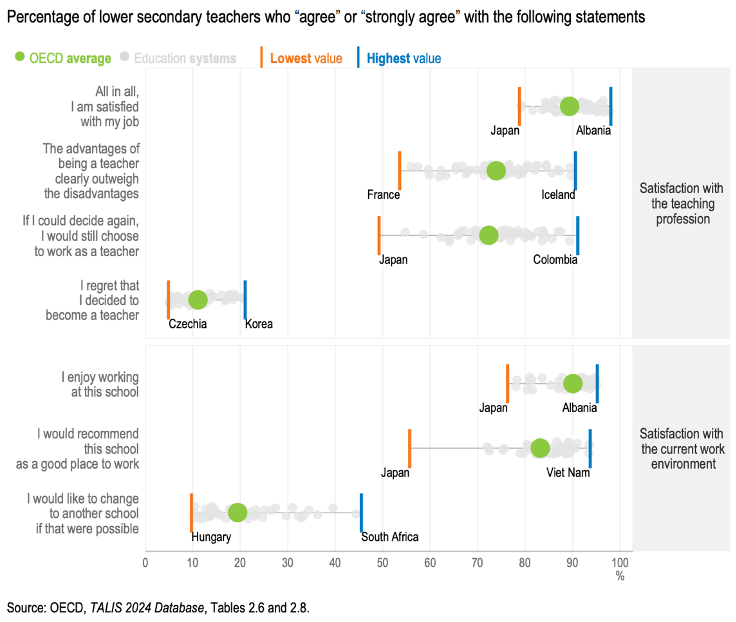
OECD Digital Education Outlook 2026: Exploring effective uses of generative AI in education, OECD
“GenAI can support learning when guided by clear teaching principles. However, if designed or used without pedagogical guidance, outsourcing tasks to GenAI simply enhances performance with no real learning gains.”
OECD says generative AI reshapes education with mixed results, Cyber News
“Education-focused AI tools grounded in learning science are delivering stronger outcomes than general-purpose chatbots, OECD analysis shows.”
GenAI can turn students into passive consumers, OECD warns, Cyber News
AI gives a ‘mirage of false mastery’ The Australian
“The dumbing-down effect of AI chatbots has been flagged in a new OECD report that warns overuse can lead to procrastination and even memory loss.“
OECD: Many Flemish teachers feel overwhelmed by AI, Belgan News Agency
Generative AI reshapes education systems, Mexico Business News
Warning over uncritical AI use in education, RTE
Students trust AI over teachers on historical errors, The Chosun Daily
“82.5% of teachers link AI use to declining literacy as students accept fabricated responses“
Digital idiots: University professors call for ban on use of AI in higher education, The Resident
Ban or Embrace? Portugal’s education system grapples with human cost of AI, Big News Network
AI around the world
Introducing OpenAI’s education for countries, OpenAI
Anthropic and teach for all launch global AI training initiative for educators, Antrhopic
AI and the digital divide in education, Frontiers
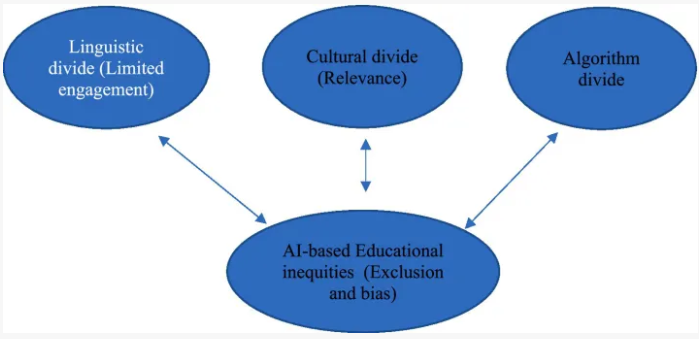
“While AI seems to make it easy for learning or education to take place easily, it also promotes or leads to some unfair advantages for some learners or students. This is due to the languages used by the AI, cultural mismatches between the AI developers and users, and algorithm bias.”
AI in schools is harming learning, IFA
“More than half of teachers across Europe (58 per cent) believe that when students use AI to complete their schoolwork, it has a negative effect on learning”
How AI is transforming education in Latin America and the Caribbean: Lessons from 193 solutions, IDB
BeConfident raises $16 million to expand AI tutoring platform beyond Latin America, Impact Alpha
Work 5.0, AI reshape education systems, Mexico Business News
“The digital learning programme provided curriculum aligned remedial content for grades 10-12 alongside teacher training and has reached more than 300,000 students and teachers nationwide.”
AI in education in Australia: Benefits, use cases & roadmap, Appenventiv
More math classes, AI, and new teachers: back to school brings new features in Paraná,
In China, AI is no longer optional for some kids. It’s part of the curriculum, NPR
What can US schools learn about AI education from their Chinese counterparts?, K-12 Dive
Unsure how AI fits into education? One Prague school offers a practical, progressive model, Expats CZ
DepEd and Microsoft accelerate learning recovery and AI literacy for Filipinos, Microsoft
Schools from Berlin and Potsdam honored for AI ideas, Berlin
AI skills for life and work: Rapid evidence review, UK Government
Early introduction of AI in Ho Chi Minh’s schools proves effective, Asia News
AI Developments and Continuing Concerns
AI use in schools and classrooms is booming as educators grapple with guidelines, CBS News
The risks and rewards of AI in school: What to know, EdWeek
A new direction for students in an AI world: Prosper, prepare, protect, Brookings
“Brookings study finds AI undermines educational and social-emotional development, as well as teacher-student trust“
Four takeaways from new report on AI’s risks in education, The74
Anthropic, Google and Microsoft fight to win teachers, Axios
Google’s work in schools aims to create a ‘pipeline of future users,’ internal documents say NBC News
OpenAI seeks to increase global AI use in everyday life, Reuters
“OpenAI is expanding its efforts to convince global governments to build more data centers and encourage greater usage of artificial intelligence in areas such as education, health and disaster preparedness.”
Microsoft joins other companies in trying to fill ai training gap in schools, Education Week
Rising use of AI in schools comes with big downsides for students, Education Week
‘Dangerous, Manipulative Tendencies’: The risks of kid-friendly AI learning toys, Education Week
‘Grok’ Chatbot is bad for kids, review finds, Education Week
“The bot shares false information—arguing for instance, that the “department of education” deliberately teaches educators to “gaslight” students and teach “propaganda”—and suggests risky behavior, including urging one user posing as a teen to run away from home.”
EU investigates Musk’s AI chatbot Grok over sexual deepfakes, PBS
Anthropic economic index: AI speeds up complex tasks, but deskills, StartupHub
“If AI were to fully automate the tasks it currently supports, Anthropic estimates this would result in a net deskilling effect on average jobs. Professions like technical writers, travel agents, and teachers would see the higher-skilled components of their roles removed first, leaving behind a simpler, less complex task composition.”
Anthropic data shows AI boosts complex work fastest, with uneven impact across jobs and countries, ETIH
Artificial Intelligence mirrors natural intelligence: Can we move beyond human education years to hybrid intelligence?, Psychology Today
“Claude does not automatically “level up” a vague or simplistic request. If you give the model a high-school-level prompt, you receive a high-school-level response. If you provide a prompt rich in nuance, structured constraints, and graduate-level reasoning, the AI meets you there. This creates a “cognitive ceiling” effect. Two individuals, using the exact same version of the same model on the same day, will see radically different results. The differentiator is the human equipment of the operator.”
AI trailblazer Google doesn’t want schools to ‘Bypass the Human’, The74
“The education sector desperately needs companies to move beyond general-purpose chatbots and build tools that actually support cognitive work rather than replace it.”
1 in 3 Pre-K Teachers Uses Generative AI at School, EdSurge
How are K–12 school leaders managing the use of AI?, Education Next
How psychologists are using AI in schools, Psychology Today
Students turn to chatbots for college guidance, Smart Brief
“A growing number of high-school students and parents are using chatbots such as ChatGPT to research colleges, organize application information and even estimate admission chances, with one survey finding that about one-third of students used AI tools in their college planning. While experts say chatbots can help fill gaps where counseling access is limited, they caution that the tools can provide inaccurate information, overly optimistic predictions and poor guidance on personal fit that human counselors are better equipped to address.”
AI assistive technology improves inclusion in K-12 environments, K-12 Dive
Short on resources, special educators are using AI – with little knowledge of the effects, The Conversation
How AI is helping NYC English teachers improve middle school reading and writing, The74
AI tutors are now common in early reading instruction. Do they actually work?, Education Week
Google DeepMind’s learnings in developing an AI Tutor, The74
Borrowing from the past productive friction in the age of AI, Getting Smart
I’m not worried AI helps my students cheat. I’m worried how it makes them feel, Education Week