As part of a symposium focused on educational innovation around the world at the annual conference of the American Educational Assocation in Chicago next week, we are sharing commentary papers from the participants. Today’s contribution is from Radhika Iyengar, of the Earth Institute at Columbia University.
A common and most often used source of education data comes from household surveys. These household surveys are helpful to measure the “impact” of the education strategies and policies adopted by developing countries. The Multiple Indicator Cluster Survey (or MICS) are household surveys that various countries along with UN agencies (specially UNICEF) use to collect data on educational outcomes-such as net attendance rate, net intake-rate, primary school survival rate. These indicators are helpful to track progress towards the Millennium Development Goals (MDGs) indicators. The primary focus of the MDGs is to measure the progress towards universal primary education for both girls and boys. The indicators focus on issues like whether girls and boys alike attend primary school at the right age and are able to complete a full primary school cycle.
Despite their potential utility, household surveys like the MICS come with a set of challenges. The process of collecting household-level data using the surveys is very time intensive. Not all countries have the time and the resources to conduct these surveys on an annual basis. Even if they do, a full population census to calculate the denominator of indicators like Net Enrollment ratio could be a decade old. For the most part, the data is entered at the national level. The data is then cleaned, processed and sent back as aggregate numbers usually at the state level. District indicators are hard to find. The schools that patiently supplied this information and the households that took time to respond to those lengthy surveys never get to see the “end product.” The data appeared to vanish in thin air and what comes back in aggregate form is usually not useful for a school or a district to measure its progress. In fact, by the time the data is released, a student who was in Grade 2 may have dropped-out or may have proceeded to the next class without learning anything.
To address this lag in feedback, The Millennium Villages Project along with the Sustainable Engineering Lab have designed and implemented an android phone-based data collection system that collects real-time data. This data is then analyzed using faster back-end processing to provide feedback to the schools and the district education offices on a monthly-basis. This data collection, management and utilization system was developed after multiple years of practice based learning from the Health care system. The processes were tightened and improved upon and tis system is now being utilized for an integrated planning approach for the Education Sector as well as the Water Sector.
Let us first try to understand why is it important to collect all this education data in the first place. Figure 1 below shows that people’s perception don’t always reflect reality. The reality is that many children are not able to do Grade 2 level literacy and numeracy even when they are in Grade 4. This seems counter-intuitive to the general perception that things are going well in education.

Figure 1. Satisfaction Results in Education (In East Africa)
Source: Pritchett (2013) . The Rebirth of Education: Schooling Ain’t Learning
However, we need quicker and useful data to make any difference. If time goes by and the people who supply this data don’t ever get to “see” the usefulness of collecting this data in the first place, these indicators may just become statistics.
In the Millennium Villages Project site at Tiby Mali, the data collected via the phone-based collection system showed an interesting geographic trend. Figure 2. presents the proportion of enrolled students attending observed classes at the time of observations for a particular month. In Tiby, Mali the data shows that the schools circled in green have a much lower student attendance than the schools circled in blue. It is surprising to see a clear geographical clustering of indicators based on the location of the schools. Why is it that the schools clustered near each other (in blue) have better attendance than the rest of the schools scattered (in green)? This map helped to form the basis of discussion with the District Education Offices. The discussions showed that the geography was a part of the problem. Schools are much more dispersed (in the north and south) than schools near the towns therefore distance to get to schools may be longer. The discussions also suggested some structural issues that promote teacher absenteeism. For instance in Mali full working days are Monday, Tuesday and Friday, with two school sessions per day but on Wednesday and Thursday schools are working with only a morning-shift. Absences are more frequent on Wednesdays and Thursdays because many teachers use those days to take care of their personal and administrative needs. The data helped to start a conversation in Mali on teacher attendance issues and made those issues much more visible and easy to understand. As a result of this early detection of the teacher absenteeism trend, government school inspectors have increased their school supervision and focus on the specific schools that showed repeated student attendance issues. The Mali example shows how stakeholders are able to use the data to assist in the functioning of the schools.
 Figure 2. Proportion of enrolled students attending observed class at the time of the visit in Tiby, Mali.
Source: Millennium Villages Project Database.
Another very important indicator is that of student’s learning levels in basic literacy skills for numeracy and language. The data are collected on a monthly basis to measure if children are falling behind. The data are intended to help the school and the teachers to plan for remedial education based on understanding the gaps in the literacy measure. For instance, if a majority of the children tested are in the word recognition category, the teachers can focus on activities that are geared towards move children from the word recognition level to higher levels of readings – reading paragraphs and simple stories. The monthly data depicted on a map from Bonsaaso, Ghana suggested that the schools that lack full time teachers are also the schools where students lack basic reading skills. Surprisingly all these schools are grouped towards the south of the cluster.
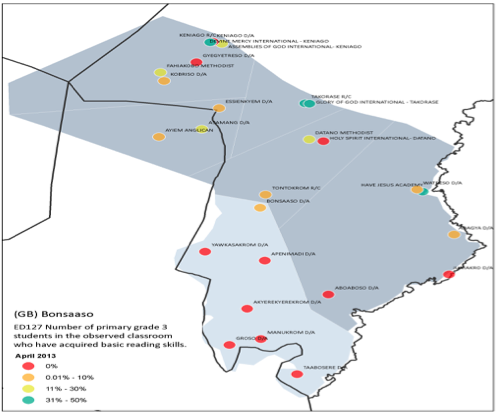
Figure 3. Reading Levels of children in Grade 3 in Bonsaaso, Ghana.
Source: Millennium Villages Project database
Further discussions with district education officials revealed that these schools are located in the remotest part of the cluster with many in the Amansie West District. The area lacks basic infrastructural amenities and teachers do not accept postings to those areas, hence lack of teachers is one of the characteristics in that area of the cluster and the district as a whole. Many of the teachers who accept postings to these areas are untrained. Since reviewing these data, multiple-stakeholder meetings have focused on improving the learning environment of these southern schools.
These case studies bring up several points. First, regarding the data collection and utilization process, frequently collected data with frequent feedback helps to make the data more useful. Also, the people who can in a position to act after seeing the data are best suited to collect the data. The closer they are to the issues, the better the data use is going to be. The second point centers on the use of technology to improve the functioning of the schools. Often the use of technology is limited to laptops used by students for learning and by teachers as teaching aids. However, the use of technology as a lever to improve education planning as a whole leaves much to be desired. “Real-time” data collection using efficient technology has more chances of being used. The time elapsed between data collection and feedback needs to be relatively short, since people forget what data was collected in the first place. We also need to keep in mind that different data users (policymakers, district officials, school members) often like to see different indicators. Therefore data displays need to be created at various levels.
However, efficient adoption of this technology-based solution for issues of data collection depends on many factors. Political will as well as local capacity to collect frequent data and disseminate the results is key. Stakeholder buy-in from a multi-sectoral perspective can help to gain insights from already existing practices from other sectors such as health. A democratic process that weighs the different data needs at the national, state and district levels is also critical in maximizing data use. This is critical since different stakeholders at various levels may have very different data uses. Who uses what data and how much capacity the system has to collect and process the data are iterative discussions. Despite relatively limited resources, innovation is still possible and can lead to quicker diagnosis and remediation. It is clear that education planning not only requires outcome indicators from the survey, but also process indicators from facility (school) inventories. A great step forward is the UN Secretariat on Data Revolution, which recognizes the importance of such facility mapping (see the case study on the Nigeria Information Management System). Real-time data leading to real-time use should be the data mantra for UN’s Post 2015 Agenda.

